Rethinking TV Efficiency Through Cost per Search
An observational study of linear TV’s impact on brand search interest.
Executive Summary
This research exercise explores the efficiency of media investment by analyzing the impact of linear TV campaigns on brand search behavior. Using publicly observable data and applying a standardized cost of search model, we assessed the performance of two competing brands that ran linear TV campaigns between January 13 and January 26, 2025. Our findings reveal that higher gross media spend does not equate to higher efficiency or effectiveness in driving consumer interest, as measured by Share of Search.
Notably, Brand B had already been active on linear TV ten days prior to Brand A’s campaign launch. During Brand A’s entry window, Brand B observed a temporary dip in perceived attention. However, our research approach demonstrated that Brand A’s aggressive, awareness-focused strategy did not translate into efficient shifts in consumer search behavior.
Methodology
Cost per Search = Total Media Spend ÷ Total Brand Search Volume
This metric allowed us to understand how much each euro of media spend translated into a tangible user action (search) on Google Trends, helping us compare not just the reach or frequency but the behavioral response driven by each brand’s linear TV investment.
To establish a consistent comparison between the two brands, we:
- Standardized target group segmentation (A25+, Germany) and media pricing using average rate cards.
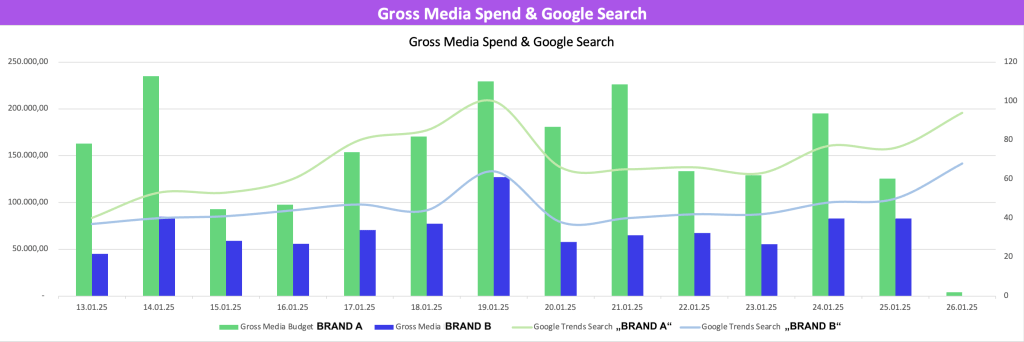
- Isolated the campaign window from January 13–26, 2025, which marks the introduction of Brand A to linear TV, while Brand B had already been live ten days prior.
- Measured media effectiveness using Cost per Search and Brand Search Efficiency (i.e., cost per share point of daily brand search interest).
- Focused only on the behavioral response (search interest) to linear TV, excluding the impact of digital or offline channels.
Note: This is a non-standard marketing measurement. The exercise was conducted to isolate and compare search behavior patterns driven specifically by linear TV presence. We used average rate cards and excluded other media channels for simplicity and standardization.
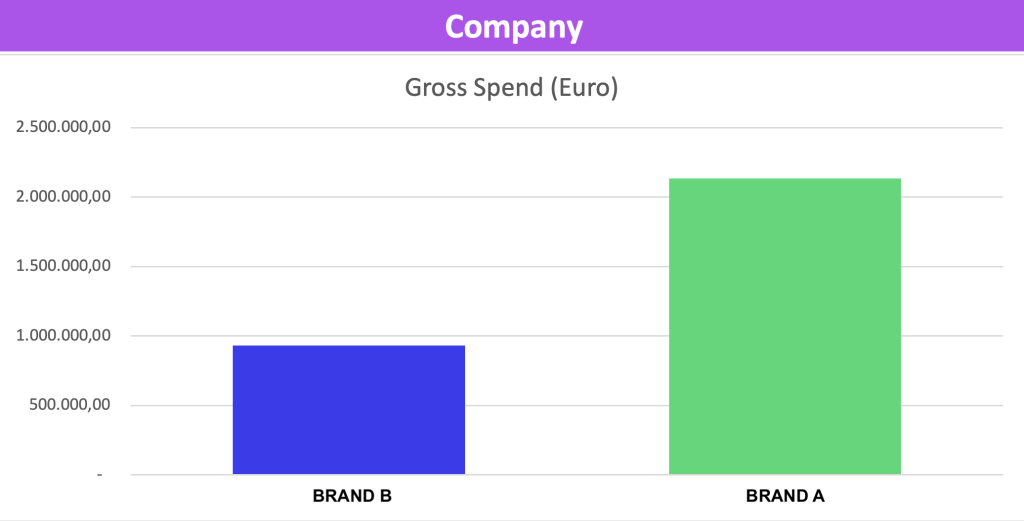
Media Spend Overview (Jan 13–26), A25+, Germany
Metric | Brand A | Brand B |
Gross Media Spend | €2,136,120.00 | €931,407.00 |
Share of Total Media Spend | 69.6% | 30.4% |
Share of Total Brand Searches | 60.3% | 39.7% |
Cost per Search (Daily Avg.) | €2,506.15 | €1,596.47 |
Brand Search Efficiency | €2,180.00 | €1,444.04 |
Net Reach | 49.8% | 49.2% |
GRPs | 165 | 192.8 |
OTS (Opportunities to See) | 4.1 | 4.8 |
CPM (Cost per Mille) | €6.78 | €2.28 |
Despite spending 129% more, Brand A underperformed in efficiency compared to Brand B, achieving:
- Lower Share of Search relative to investment
- Higher cost per search
- Reduced brand search efficiency
Higher CPM, lower GRPs and OTS despite a heavier focus on premium placements
Channel Mix Comparison
To help determine the TV campaign’s media strategy, channels are grouped based on reach and CPx performance, guided by CPM and target group affinity. This process yields three strategic clusters:
- Frequency Cluster (FC) = Small market share (<0.29%), only performance focus, low CPM; limited scalability.
- Volume Cluster (VC) = Advanced market share (0.3–2.0%), performance-driven with spillover effects; scalable.
- Awareness Cluster (AC) = Huge market share (>2.1%), spillover effects; highly scalable.
Testing different combinations of these clusters helps refine and optimize the overall media plan.
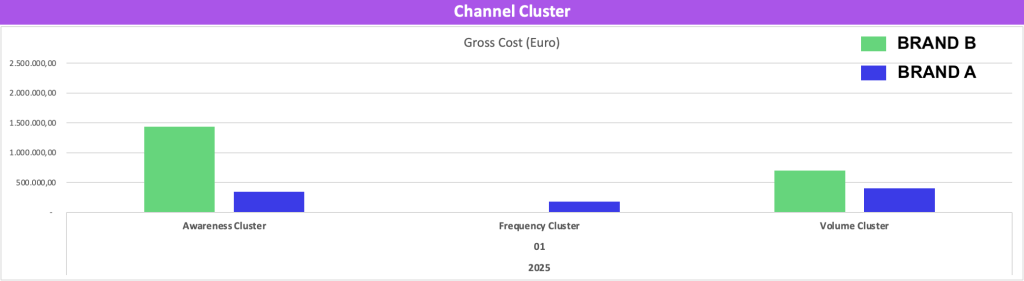
Cluster Type | Brand A | Brand B |
Awareness Cluster (AC) | 67% | 32% |
Volume Cluster (VC) | 33% | 20% |
Frequency Cluster (FC) | 0% | 43% |
Brand B utilized a more balanced cluster mix that included significant investment into frequency-driving placements, while Brand A focused nearly exclusively on broad awareness through premium channels.
This diversified strategy helped Brand B achieve:
- Better repetition (supporting memory and behavior)
- Higher efficiency at lower cost
- Comparable reach and stronger engagement per euro spent
Performance Insights
- Higher Spend ≠ Higher Efficiency
Brand A, with over double the budget, captured a smaller proportional share of search, resulting in a significantly higher cost per search action. - Sustained and Balanced Investment Pays Off
Brand B’s consistent daypart distribution (balanced across daytime, early evening, and prime time) contributed to steadier and more efficient search engagement over the campaign period.
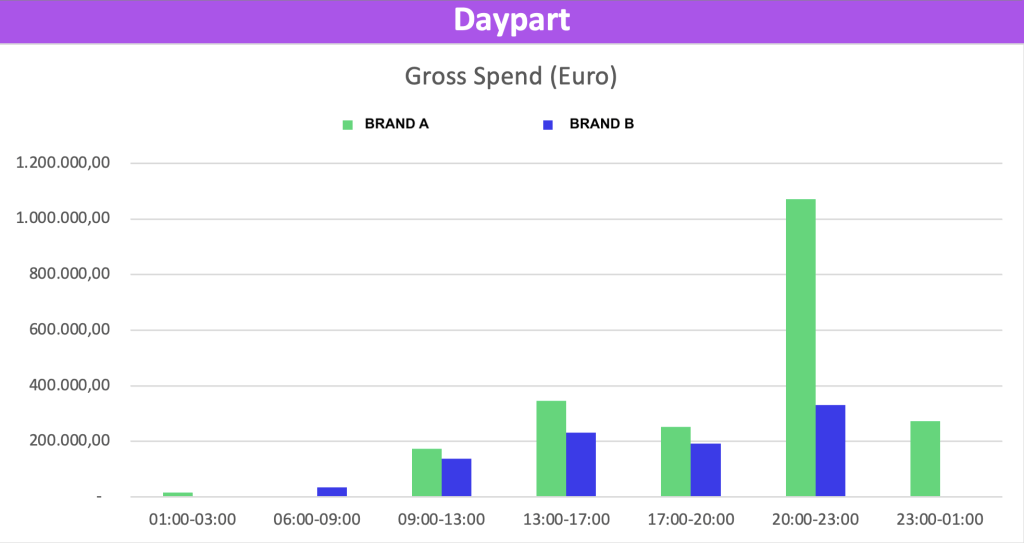
Daypart Allocation Matters
Brand A concentrated over 50% of its budget in expensive prime-time slots, whereas Brand B spread its spend more evenly across lower-cost and mid-performance windows.
Conclusion
The results of this comparative exercise reinforce the principle that media effectiveness depends not only on budget size but also on strategic allocation and message delivery. Optimized spend for reach, balanced frequency, and tactical attention scheduling have the potential to outperform brute-force investment in terms of search response and cost efficiency.
This study also highlights that Brand B’s earlier and steadier TV presence allowed it to defend and even grow search attention during Brand A’s heavy push—proving that efficient spend can match or beat brute-force exposure in real audience behavior.
Footnote
This analysis is not based on marketing-mix modeling or multi-touch attribution. It is a simplified exercise designed to observe changes in search behavior in response to linear TV campaigns between January 13–26, 2025. It excludes the influence of digital or other traditional channels. All cost and reach figures are standardized using average agency rate cards.