A few tips and tricks on measuring OOH’s impact
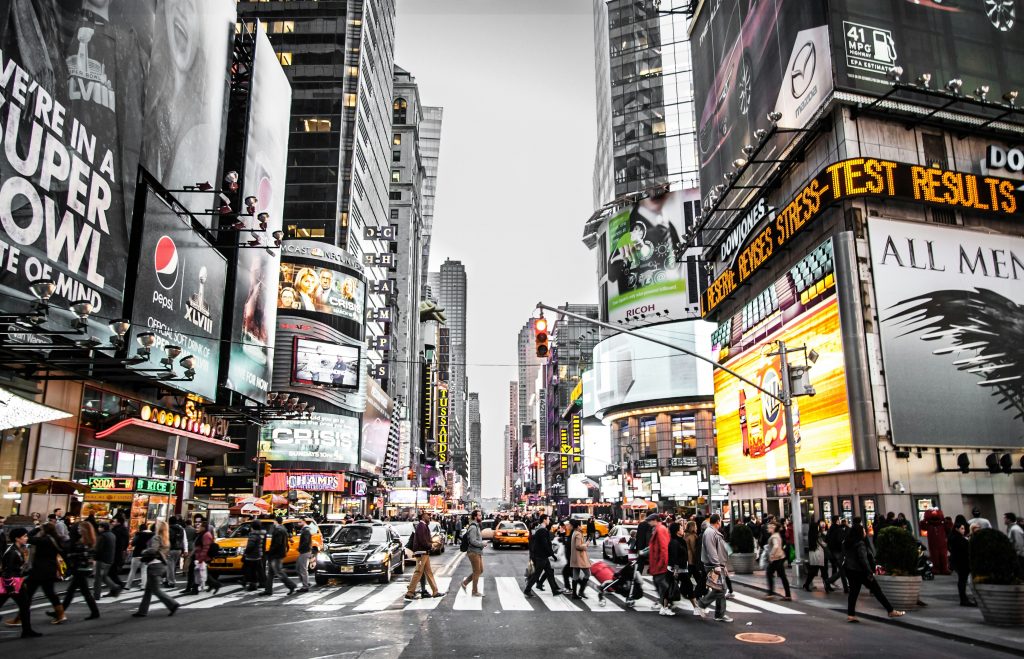
Billboards. CLPs. Wild Posters. Digital OOH…
OOH is hard to miss.
But measuring its impact? That’s a different story.
Unlike clicks and conversions in digital, OOH performance is spread across the real world.
That doesn’t mean it’s a guessing game.
It just means the tools are different—and thankfully getting smarter.

Let’s walk through the main ways marketers measure OOH effectiveness.
1. Reach and Impressions
What it tells you:
How many people could have seen your ad (reach), and how many times it was displayed (impressions).
Think of it as the starting point—your potential audience.
Strengths:
- Easy to calculate
- Great for top-of-funnel visibility
Limits:
- Doesn’t tell you what people actually did after seeing the ad
2. Foot Traffic and Location Data
What it tells you:
Who was physically near your ad, tracked through mobile device data. Useful for campaigns aiming to drive store visits.

Strengths:
- Real-world exposure
- Possible to link visits to specific locations
Limits:
- Doesn’t reflect memory, engagement, or brand perception
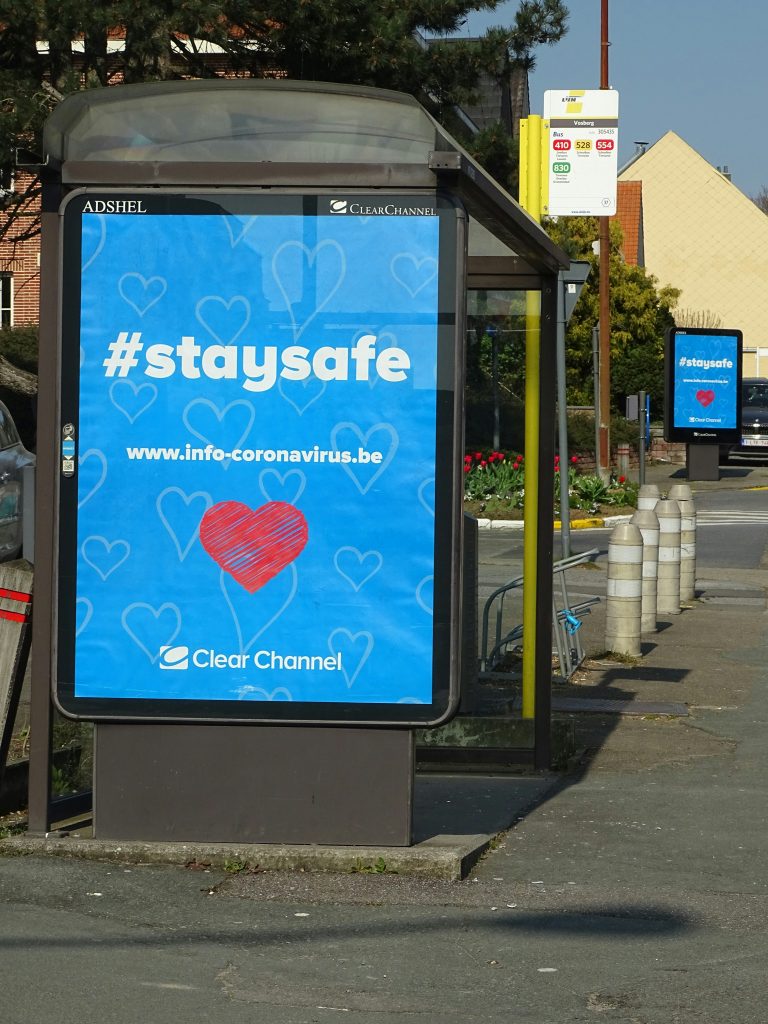
3. Engagement and Interaction
What it tells you:
Did someone scan your QR code? Tap an NFC tag? Use a campaign hashtag?
Strengths:
- Measures active audience interaction
- Great for campaigns with clear calls to action
Limits:
- Data reflects only a slice of your audience—mostly the curious or tech-savvy
4. Brand Lift Studies
What it tells you:
How people feel after seeing your ad—are they more aware, more interested, more likely to buy?
Strengths:
- Deep insights into perception and intent
- Ideal for long-term brand building
Limits:
- Time-consuming and costly
- Needs surveys or interviews
5. Sales and Conversion Uplift
What it tells you:
Did sales go up in areas where the ad ran? Can you spot a conversion spike?
Strengths:
- Direct link to business outcomes
- Easy to present to stakeholders
Limits:
- Hard to isolate OOH from other influences
6. Bayesian Analysis with Control Cities
What it tells you:
Compares cities that saw the ad to those that didn’t, using Bayesian statistics to estimate the true lift.
Example:
Scenario: A coffee brewing chain, GLADTOBE BREWING, launches an OOH advertising campaign in City A to increase brand awareness and foot traffic. They use City B as a control, which has similar demographics but no GLADTOBE BREWING OOH ads.
Steps for the setup:
- Define Prior Beliefs:
Let’s assume, based on past campaigns, GLADTOBE BREWING believes there’s a 60% chance (0.6 probability) that the OOH campaign will increase foot traffic by at least 5%. This is our prior belief. - Select Cities:
City A (Test): Receives the OOH campaign. City B (Control): No OOH campaign. Both cities have similar demographics and economic conditions. - Collect Data:
Over a month, they collect data on foot traffic to GLADTOBE BREWING locations in both cities. - Apply Bayes’ Theorem:
After a month, the data shows foot traffic increased by 8% in City A and 2% in City B. Using Bayes’ Theorem, the prior belief is updated with this evidence. The posterior probability is calculated to estimate the true impact of the OOH campaign, considering the increase in the control city.
Extra: - Determine Counterfactual: The 2% increase in City B (control) suggests some baseline growth. The counterfactual is what would have happened in City A without the OOH campaign. We estimate this by attributing the 2% increase in City A to the same baseline growth, estimating that the OOH campaign led to a 6% incremental increase (8% – 2%).
You still following?

Because there are many additional factors that could be taken into consideration to help refine the analysis. Factors such as weather, local events, and competitor activities can be added into the equation to help improve the model’s accuracy.
Strengths:
- Highly accurate if done well
- Accounts for external factors (weather, seasonality, etc.)
Limits:
- Complex modeling
- Needs clean data and strong methodology
Final Thought:
OOH isn’t a one-metric game.
Each method has its place. The key is knowing your campaign’s goal, and ofcourse, matching the measurement to fit.
So next time you are investigating whether to activate an OOH Campaign, ask yourself:
Are you looking to build awareness? Drive store traffic? Trigger online conversions? Different goals, different tools.
Let us help you plan your next OOH campaign; we’ve got the planning tools and we will ask the right questions 🙂


