How We Evaluated Regional Brand Lift Across Two Waves
Executive Summary
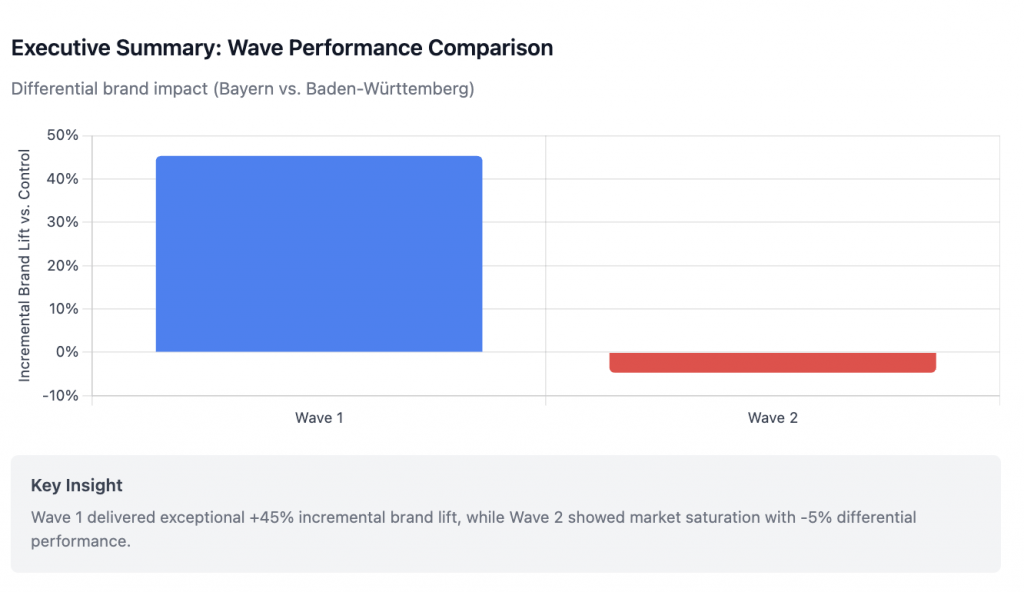
We analyzed a two-wave Connected TV (CTV) campaign in Germany using multiple measurement approaches to understand brand impact. While performance metrics (clicks, conversions) were available, we focused on measuring brand strength through search volume analysis. The findings were striking: Wave 1 delivered exceptional results with 45% incremental brand lift, while Wave 2 showed diminishing returns with -5% differential performance. This case study demonstrates how search data can reveal brand saturation patterns and guide smarter media investments.
The Business Challenge
When investing in regional Connected TV (CTV) and Advanced TV (ATV) advertising, every CEO and growth leader faces the same critical questions: “Did our CTV/ATV campaign actually have an effect on the region? And if yes, how do we measure it?”
Often, this question comes after the campaign has already run. In our case, while we could track immediate performance metrics (clicks, conversions, etc.), the Head of Brand posed a different challenge: “How did this campaign impact our brand strength at the regional level?”
This is a much harder question to answer. Brand impact isn’t just about immediate conversions—it’s about mindshare, consideration, and long-term market position. After running two waves of CTV/ATV campaigns in Germany, we needed to find a way to measure true brand impact retroactively.
Here’s how we solved this measurement challenge using search volume as a proxy for brand interest—and what we discovered about diminishing returns.
Campaign Overview
The Setup:
- Product: Consumer electronics (refurbished marketplace)
- Channel: Connected TV / Advanced TV (streaming platforms)
- Target Audience: Male heads of household, average age 37
- Campaign Market: Bayern (Bavaria), Germany
- Wave 1: March 31 – May 4, 2025
- Wave 2: June 2 – July 6, 2025
The Measurement Challenge: After both campaigns had run, we needed to retroactively measure their impact. We selected Baden-Württemberg as our primary control market because it:
- Had similar market characteristics to Bayern
- Was a neighboring region with comparable demographics
- Showed similar pre-campaign search patterns
We also analyzed other German regions (Hessen, Lower Saxony, North Rhine-Westphalia, Saxony) to validate our findings and build synthetic controls.
Our Measurement Approach
Since the Head of Brand wanted to understand brand impact rather than just performance metrics, we used search volume as our primary KPI. Search volume serves as an excellent proxy for brand interest because it captures:
- Unprompted awareness: People actively searching for your brand
- Consideration: Intent to learn more about your products
- Word-of-mouth effects: Searches driven by recommendations
We used three complementary methods to ensure reliable results:
Method 1: Post-Hoc Regional Comparison (Difference-in-Differences)
Since we couldn’t pre-select control markets, we retrofitted this approach:
- Identified Baden-Württemberg as the most comparable region (similar size, neighboring location)
- Pulled historical search data for both regions going back before Wave 1
- Measured performance in Bayern before, during, and after each campaign
- Did the same for Baden-Württemberg
- Compared the differences
The logic: If Bayern grew 60% during the campaign but Baden-Württemberg only grew 15%, the incremental impact is approximately 45%. This works even retrospectively if the regions were truly comparable pre-campaign.
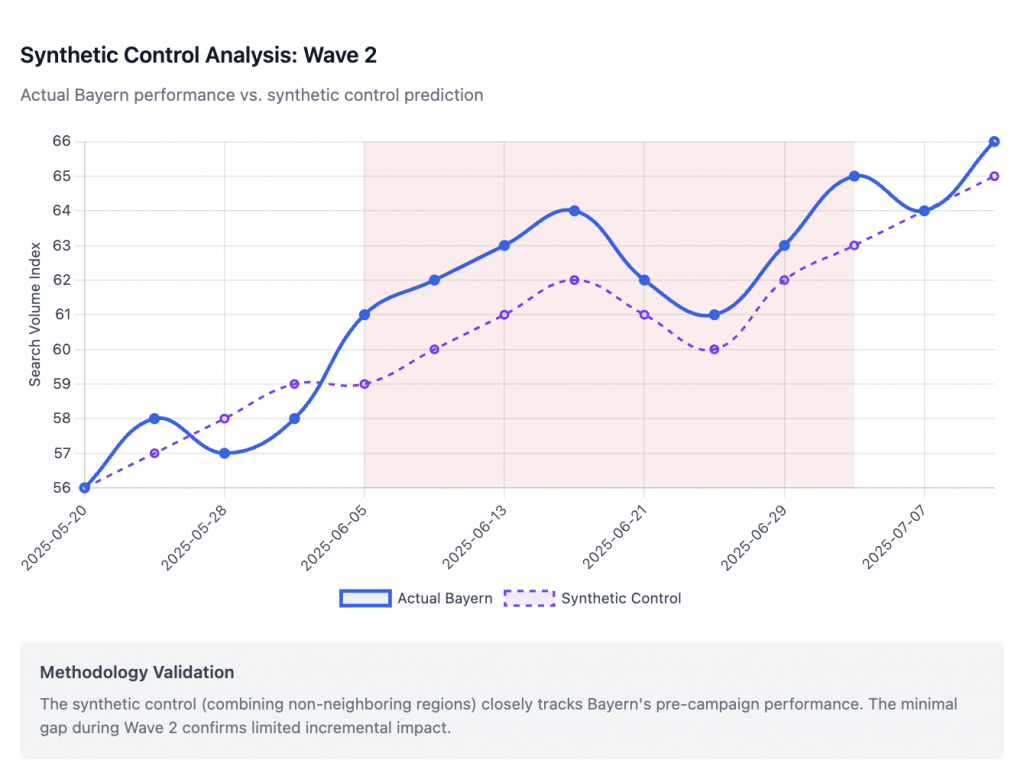
Method 2: Synthetic Control
Sometimes one control market isn’t enough. This method creates an “artificial Bayern” by combining data from multiple control regions:
- North Rhine-Westphalia (weight: 42%)
- Lower Saxony (weight: 35%)
- Saxony (weight: 23%)
This weighted combination historically matched Bayern’s patterns, allowing us to predict what would have happened without the campaign.
Method 3: Time Trends Analysis
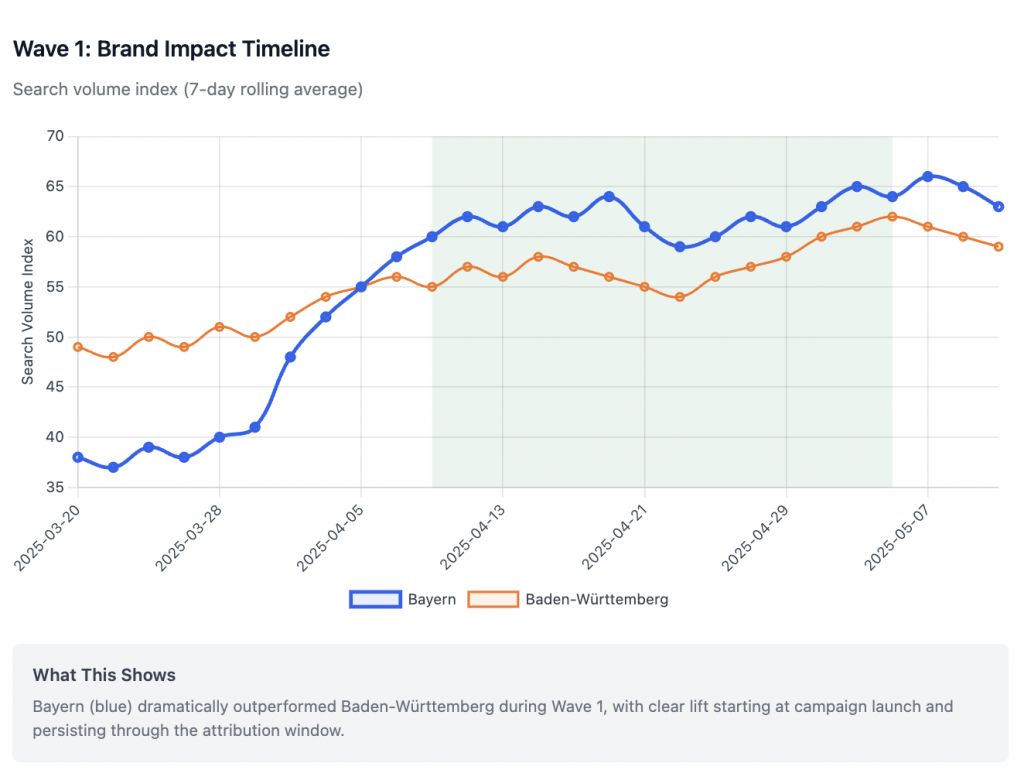
We smoothed daily fluctuations using 7-day rolling averages to identify true patterns versus random noise. This helps separate genuine campaign effects from day-to-day volatility.
Key Findings
Wave 1: Outstanding Success
The Numbers:
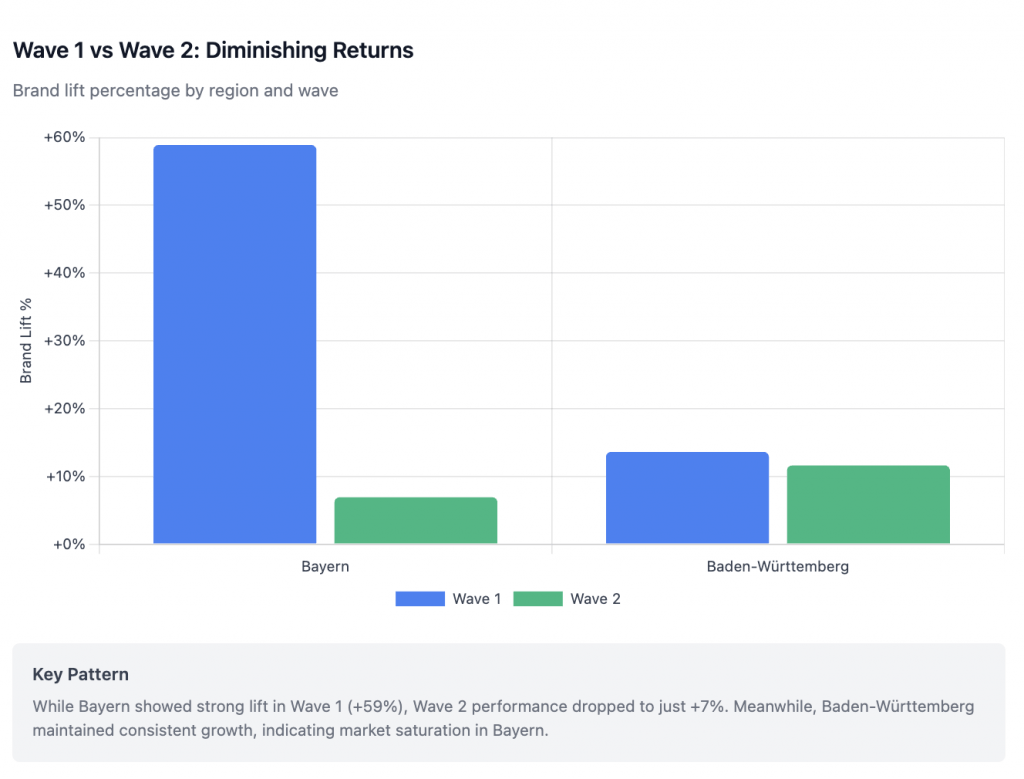
- Bayern’s search volume increased 59% during the campaign
- Baden-Württemberg (control) increased only 14%
- Net incremental effect: +45%
What This Means:
- The campaign successfully built brand awareness and interest
- Search volume lift indicates increased brand consideration
- Effects persisted even after the campaign ended (+46% in the 7-day attribution window)
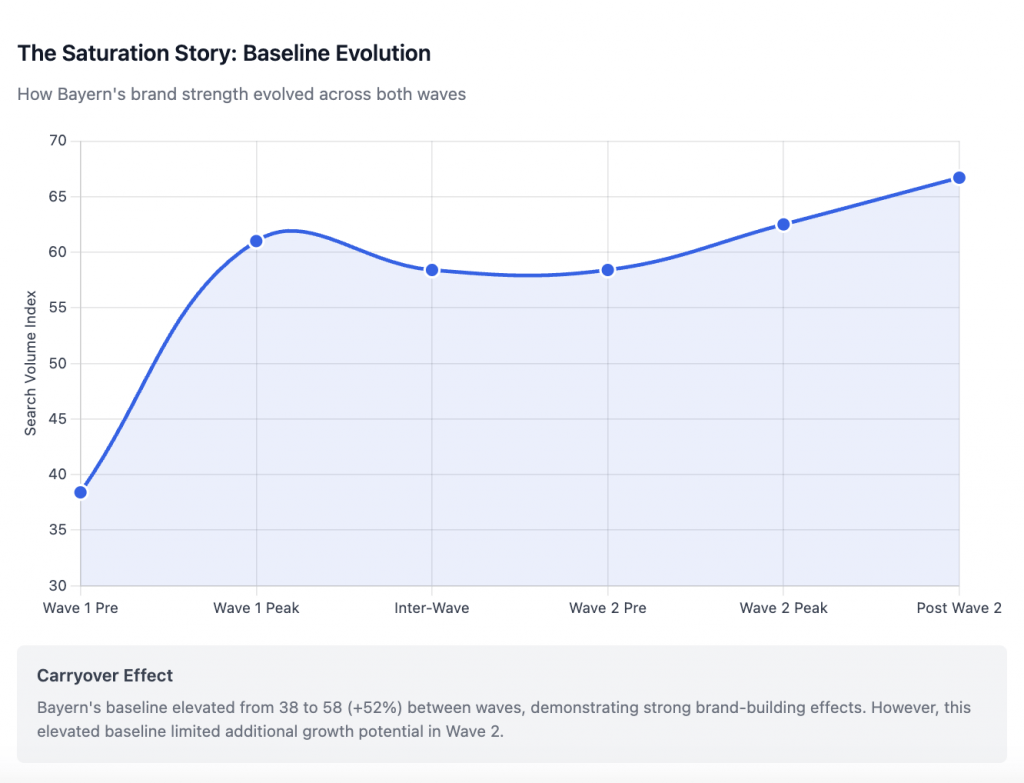
- Bayern’s baseline brand strength elevated from 38 to 58 points—a lasting brand equity improvement
Wave 2: Diminishing Returns
The Numbers:
- Bayern’s search volume increased only 7% during Wave 2
- Baden-Württemberg increased 12%
- Net incremental effect: -5% (the control actually outperformed the test)
What This Means:
- The same investment yielded dramatically lower returns
- The control market’s stronger growth suggests broader market trends Bayern couldn’t capitalize on
- Clear evidence of market saturation
The Saturation Story
Here’s what happened between waves:
- Elevated Baseline: Bayern’s starting point for Wave 2 (58) was 52% higher than Wave 1 (38)
- Audience Exhaustion: Most of the target audience was already reached in Wave 1
- Mathematical Reality: It’s harder to show percentage growth from a higher base
- True Saturation: Even accounting for the math, Wave 2 underperformed
Validation Across Methods
All three measurement approaches confirmed the same pattern:
Method | Wave 1 Effect | Wave 2 Effect |
Simple Comparison | +45% | -5% |
Synthetic Control | +15% to +270%* | +8% to +15% |
Time Trends | Strong positive | Minimal/negative |
*Wave 1 synthetic control showed high uncertainty due to poor model fit
Practical Implications
1. First-Mover Advantage is Real
Wave 1’s exceptional performance demonstrates the value of being first to market with CTV advertising in a region. Early movers can capture significant mindshare.
2. Saturation Happens Faster Than Expected
Just one successful campaign wave was enough to largely saturate the target audience in Bayern. The narrow targeting (males, age 37) likely accelerated this saturation.
3. Carryover Effects Create Lasting Brand Value
The 52% baseline elevation between waves shows that Wave 1’s impact persisted. This is exactly what brand builders want to see—the initial investment created durable brand equity, not just temporary performance spikes.
4. Know When to Pivot
Wave 2’s underperformance is a clear signal to:
- Expand to new geographic markets
- Broaden the target audience
- Test different creative approaches
- Allow longer gaps between campaigns
Lessons we can learn together
On Measurement:
- Control markets can be selected retrospectively: While pre-planned tests are ideal, post-hoc analysis using comparable regions can still yield valuable insights
- Multiple methods build confidence: When three different approaches show the same pattern, you can trust the results
- Historical data is gold: Having search data from before the campaign enabled our entire analysis
- Geography matters: Neighboring regions (like Baden-Württemberg) make good controls due to similar market dynamics
On Strategy:
- Plan for saturation: Build expansion strategies before you need them
- Document everything: Market conditions, competitive activity, and methodology choices affect future analyses
- Consider total market dynamics: Wave 2 taught us that sometimes control markets can outgrow test markets due to broader trends
On Investment:
- Front-load investment: Wave 1’s superior returns suggest investing heavily in virgin markets
- Set saturation thresholds: Define in advance when diminishing returns justify geographic expansion
- Value carryover effects: Include lasting baseline improvements in ROI calculations
Technical Notes (For the Data-Curious)
Data Source: Google Trends search volume data (indexed 0-100) – used as a proxy for brand interest and awareness
Statistical Confidence:
- Wave 1: 100% probability of positive effect
- Wave 2: 15% probability of positive effect (85% chance the campaign actually hurt)
Model Quality:
- Good models have MAPE (Mean Absolute Percentage Error) below 20%
- Wave 1 synthetic control: MAPE 49% (poor fit, high uncertainty)
- Wave 2 synthetic control: MAPE 18% (good fit, reliable estimates)
The Bottom Line
This analysis revealed a classic brand-building pattern: spectacular initial brand lift followed by market saturation. By using search volume as a proxy for brand strength, we could quantify something typically considered unmeasurable—regional brand impact from CTV/ATV campaigns.
The key insight? Wave 1 successfully built lasting brand equity in Bayern (52% baseline elevation), but Wave 2 hit the saturation point where additional investment yielded minimal incremental brand value.
For the Head of Brand, this answers the critical question: Yes, the CTV/ATV campaign significantly impacted brand strength at the regional level, but only up to a saturation point. For Bayern, it’s time to let the brand equity mature while exploring new markets for growth.
Methodology Appendix
For those interested in implementing similar analyses, here’s a simplified overview:
Difference-in-Differences:
- Campaign Effect = (Test Market Lift %) – (Control Market Lift %)
- Requires: Similar markets, clean geographic separation, no spillover
Synthetic Control:
- Creates weighted combination of control markets
- Weights chosen to match pre-campaign patterns
- Validates results when single control market might be biased
Success Metrics:
- Incremental lift vs. control market
- Statistical confidence in results
- Persistence of effects post-campaign
- Model fit quality (R², MAPE)
Remember: The goal isn’t perfect measurement—it’s directionally accurate insights that drive better decisions.
A Note on the Analysis Process
I have to give credit where it’s due. This analysis wouldn’t have been nearly as comprehensive without Claude Opus 4 as my analytical sparring partner. When you’re deep in the data, it’s invaluable to have an AI that can:
- Help validate methodological approaches (“Does this synthetic control make sense?”)
- Spot patterns I might have missed (“Have you noticed the baseline elevation between waves?”)
- Challenge assumptions (“What if the control region had spillover effects?”)
- Generate visualizations and calculations on the fly
What impressed me most was Claude’s ability to keep up with complex statistical discussions while also helping translate findings into executive-friendly language. When I’d get too technical, Claude would remind me that the CEO needs to understand the “so what?” not the statistical proofs.
The interactive analysis process—uploading CSVs, iterating on calculations, refining visualizations—felt like having a senior data scientist on the team who never gets tired of running “just one more analysis.” For any growth leader dealing with complex attribution questions, I highly recommend this approach: rigorous methodology combined with AI-powered analysis and validation.
Sometimes the best insights come from having a brilliant (artificial) sparring partner who asks the right questions.


